


With our FSA module, we bring you a hands-on and systematic way to learn the basics of financial statement analysis. In this post, I’ll discuss why we developed this module and discuss some of the advantages of the approach we have taken.
In my mind, the main difficulty students have with financial statement analysis, and frankly that instructors have with teaching it, is that there is a big gap between theory and practice. Using a simplified “textbook” example abstracts away from all of the details you encounter with real-world financial statements. Using the actual statements of only one or two companies is helpful, but the knowledge may not be easily transferable to other companies. And the more you focus on actual statements, the more you focus on details and perhaps lose sight of the bigger picture.
So the challenge was to come up with something that keeps the focus on the conceptual framework and lets you see how the details you encounter in real world financial statements fit into this framework. At the same time, we wanted a manageable way for students to gain experience and develop judgment by working with a large set of companies if they wanted to.
The FSA module achieves these goals.
First, there is emphasis on practice. It uses only real world financial statements. You can use the filings of any of the over 4000 companies we currently cover. These are (mainly US) companies that file using the SEC’s interactive data format. The filings from other countries are not as easily accessible; we have a data project underway where we are manually converting statements of Australian, European, and Canadian companies into an accessible format. The filings are updated every night.
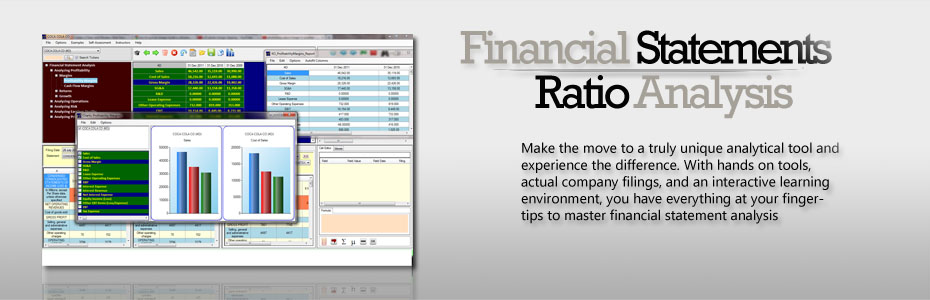
Second, there is a conceptual framework through which you analyze companies. The topics here are fairly standard (profitability analysis, risk analysis, etc.). What is unique is that you literally drag the information from the statements and drop it into the conceptual framework. This way, you see first hand what is needed for what analysis, how companies present information, what items you have to aggregate or disaggregate, and so on.
To help with this, we also provide a Self-Assessment data set. In this data set, we have gone through the analysis for several companies. The software then guides you step-by-step though the process of analyzing any company in the data set. You can ask for detailed help or less detailed help, even no help. You can practice this repeatedly. For example, you can start with detailed help, and repeat the process with less help. Or you can do the opposite: start with no help, and then turn it on if you get stuck. The ability to practice really helps in bridging the gap between theory and practice.
For individuals, the FSA module provides an intuitive and interactive way to learn the theory and the practice. The self-assessment data set guides you through the steps so you are not left guessing whether you are doing something correctly. You can work at your own pace, repeating an exercise as many times as you like. By saving your work, you can add to your knowledge over time without having to restart every time.
For instructors, we have additional tools, described under the “Instructors” section of this site. You can assign you own practice data for the students for a company you choose. You can also “grade” assignments by checking how student solutions compare to yours: you assign a problem and a company; the students work through the exercise and send you their answers; the software quickly compares your solution to those of all the students.
The videos on this site are probably the easiest way to see how the FSA module works. We encourage to ask us questions on this site, and tell us about features you would like to see covered.


