The Toolbar
Just above the calculator is the toolbar:
If you hold the mouse cursor over any icon, you will see a description of the icon.
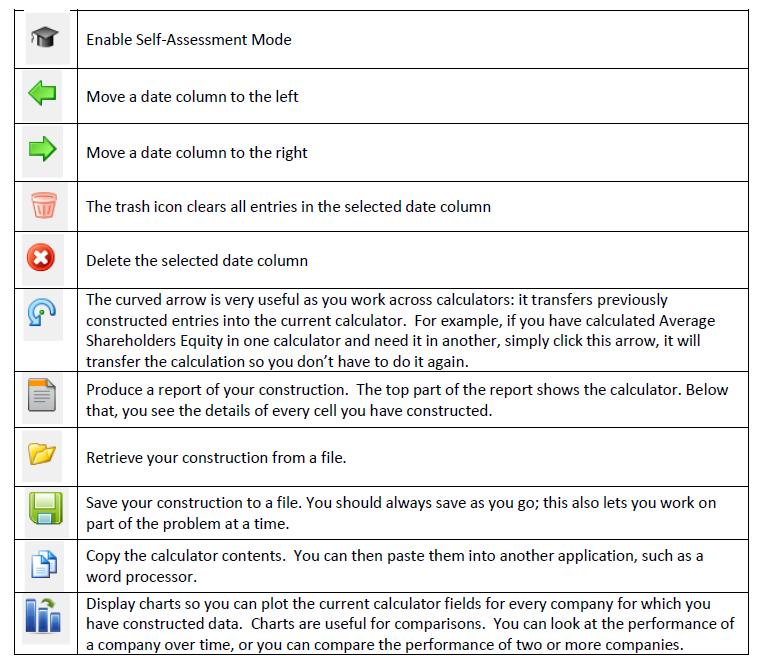
Charts
Charts are useful for comparisons. You bring up charts with the Charts icon on the Toolbar.
You can look at the performance of a company over time, or you can compare the performance of two or more companies. Once you have completed a construction for either two companies or over multiple dates for a company, you can view the calculator results graphically. For example:

