Constructing Ratios: A Worked Example
So: select Coca Cola (KO) as the company, and then select the Latest 10-K (which at the time of this writing was the Feb 2012 filing), and select Fundamental (Sustainable) Growth as the topic of study:

Hint: just next to the filing date, you will see the little symbol . If you click that, it sets the filing dates on all the viewers to this one, and saves you setting them separately.
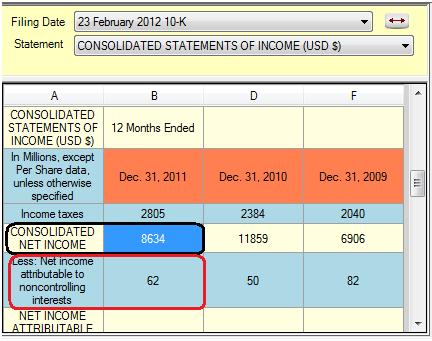
. If you click that, it sets the filing dates on all the viewers to this one, and saves you setting them separately.Next comes the all important construction date. This is the period ending date on the statement (not the filing date). For example, if you look at Coca Cola’s February 2012 10-K filing, you will see this in the Consolidated Statements of Income:

The statement has data for three dates: the periods ending Dec 31, 2011, then 2010, and then 2009. So we can conduct the analysis on one or more of these dates; if you want to look at trends, you will want more than one date. We will do only one date in this example, Dec 31, 2011 since our focus is on the mechanics of the construction.
So: Drag and Drop the Date Dec. 31, 2011 (with the orange background) and drop it into the blue area of the calculator. You should see:

You can see the default value of every input field (green background) is zero.
The first field needed is the Consolidated Net Income. This is reported on the income statement, outlined in black here:
So just drag and drop the number into the cell in the calculator, to get:

Coca Cola reports its Net Income to NCI (Non Controlling Interest) on the next line (outlined in red above), so drag and drop that into the appropriate cell. The calculator now looks as follows:

Next, we need the Average Shareholders Equity. The average means we take the average of the beginning of year and the end of year values (i.e. the average of Dec 31, 2010 and Dec 31, 2011). The shareholders equity is reported on the balance sheet, so select that statement in a viewer and scrool down to see:

We have to calculate the average of 31635 and 31003. To do this, drag them both into the calculator cell for Average Shareholders Equity. You should see the following in the calculator and in the cell editor:


The calculator only shows the first value, but both are in the Cell Editor. The calculator actually shows whatever is shown as the formula in the Cell Editor. When you drop a value into a calculator cell, the first this you drop becomes the formula. If you drop multiple things, like we have done, you have to edit the formula. You can type in arithmetic formulas, including parentheses, and click OK when you are done to enter the formula value into the cell editor.
Here, we will use the shortcut button, marked m (pronounced “mu”, a Greek letter commonly used to denote a mean or average). Clicking this will automatically create the average and transfer it to the calculator. The result of clicking m is:


The formula has been adjusted to the average, and the result, 31319, transferred.
Next, we need the field Dividends Paid. These are reported on the cash flow statement:

You can see that Coca Cola reports dividends as a negative number; other companies report this as a positive number. The software expects a positive number, so after dragging and dropping the value to the calculator cell, we have to fix the sign in the Cell Editor; this is easily done by clicking the minus sign in the cell editor; it simply changes the formula to the negative of the formula and adds parentheses. In our case, the result of clicking the minus sign is:


And we are done: the sustainable growth for Coca Cola is 13.64%, and the return on equity is 27.37%


